
Backend dashboards show healthy pods while users stare at a frozen checkout button. Lab Lighthouse is green on ethernet; field LCP is red on mid-tier Android.
Frontend observability is how you see what the browser lived through: errors, timings, vital metrics, and journey outcomes.
Web Vitals field measurement and RUM practices exist because synthetic tests are necessary but not sufficient — real devices, networks, and extensions change the story. Google’s Web Vitals program is explicitly about real-user experience quality.
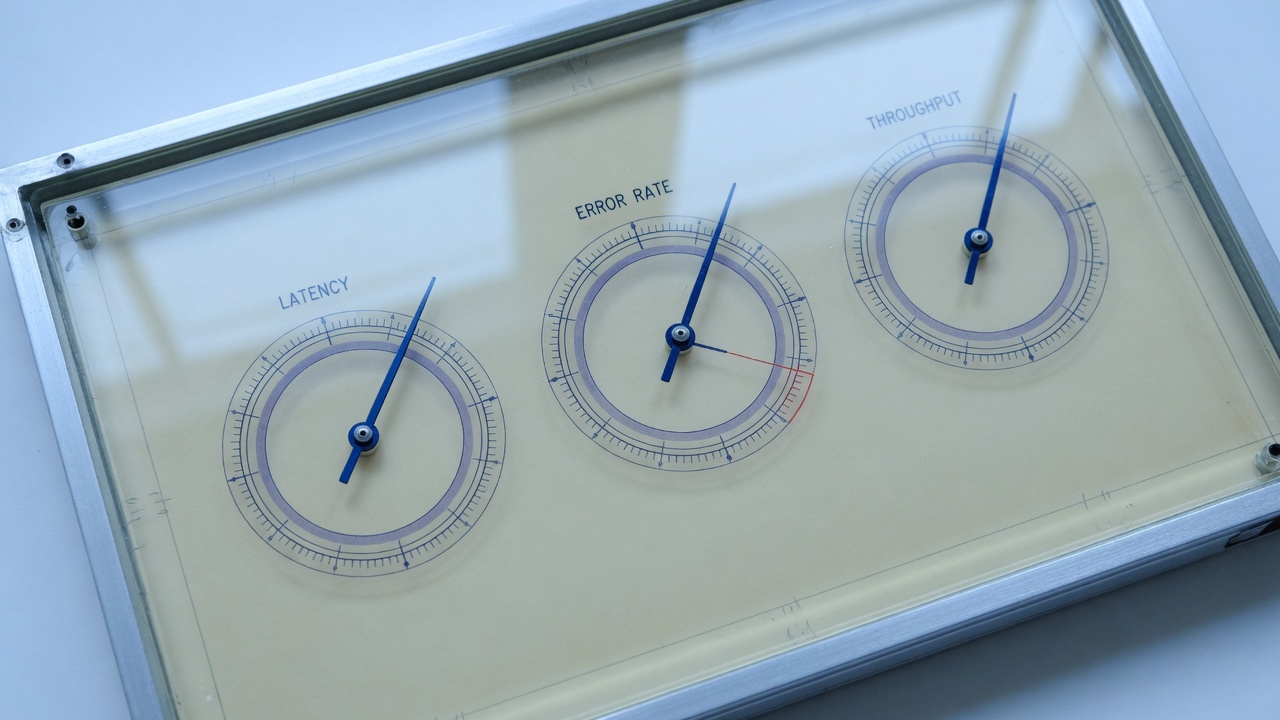
Read the needles users actually move.
Minimum viable signals
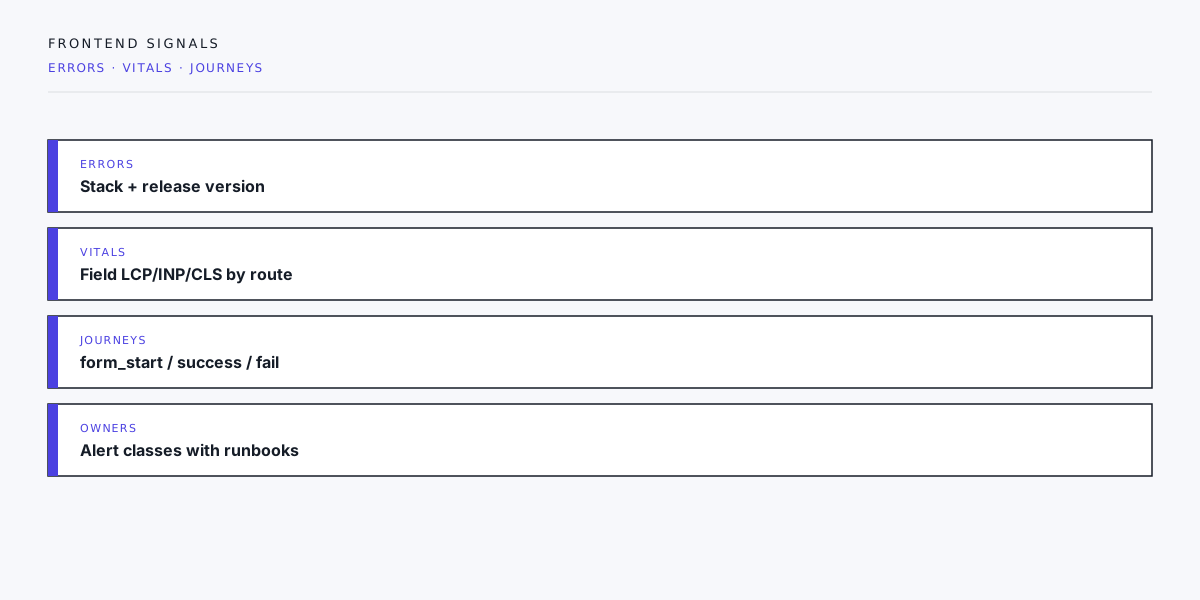
- JavaScript errors with stack, URL, and release version
- Core Web Vitals in the field (LCP, INP, CLS) sliced by route
- Journey events —
form_start,form_success,form_fail - Resource failures — 404 assets, blocked third parties (sampled)
- Release marker — so you can bisect regressions
Privacy and consent
Scrub PII from URLs and payloads. Sample high-volume beacons. Honor consent for non-essential analytics tags. Whether error reporting is essential is a legal/product call — do not invent it alone, but do not ship silent clients either.
Action loops
Signals without owners are expensive noise. Each alert class needs a human and a runbook: spike in form_fail after deploy → rollback checklist. Weekly review of top errors beats a museum of dashboards nobody opens.
Lab and field together
Use lab tools as PR gates. Use field data as truth. A green lab score with red field LCP means your test is not the user.
Closing
Instrument the paths that make money and trust. Then lab tools become guards, not oracles.
Need RUM and vitals wiring on a marketing or app shell? Start a project inquiry with your top three user journeys.
Sampling and cost
Full fidelity for every page view is expensive and often unnecessary. Sample vitals; keep errors at high capture rate with grouping. Cap payload size. Drop noisy browser extensions when you can detect them.
Release health
Mark releases in your RUM tool. Compare error rate and LCP p75 for 24–48 hours after deploy. Automated rollback is ideal; human on-call with a clear chart is minimum.
Journey analytics vs vanity
Prefer completion rates (form success / form start) over raw pageviews. Pair with server-side lead counts to catch client-side success lies.
Third parties
Monitor when marketing tags block main thread or fail. Your observability should show “their script” as a first-class suspect when INP degrades after a tag change.
Dashboard for eng
One screen: p75 LCP by top routes, JS error rate, form fail rate, release list. If the dashboard needs a training course, it will not be used during incidents.
Correlation with backend
Pass request_id from edge to browser when possible so a form fail in RUM matches a server log line. Without correlation, teams argue about “client vs server” for hours.